Uptime Kuma: Self-Hosted Uptime Monitoring and Status Pages
Uptime Kuma is a self-hosted monitoring tool that checks whether your services are up and creates beautiful status pages. It's the open-source alternative to services like UptimeRobot, Pingdom, or Better Stack — with more features, better looks, and no monthly subscription.
Photo by Dean Pugh on Unsplash
Why Uptime Kuma?
Compared to hosted monitoring services:
- Free — No per-monitor pricing or plan limits
- Private — Your monitoring data stays on your server
- Flexible — More monitor types than most paid services
- Beautiful status pages — Public-facing pages to show your service health
- Self-contained — Single Docker container, no external dependencies
Compared to other self-hosted options (Gatus, Statping):
- Best UI — The most polished interface in the self-hosted monitoring space
- Active development — Regular releases with new features
- Large community — Well-documented, many guides available
- Status pages — Built-in public status pages (most alternatives lack this)
Installation
# docker-compose.yml
services:
  uptime-kuma:
    image: louislam/uptime-kuma:1
    container_name: uptime-kuma
    ports:
      - "3001:3001"
    volumes:
      - uptime_data:/app/data
    restart: unless-stopped

volumes:
  uptime_data:
docker compose up -d
Access at http://your-server:3001. Set up your admin account on first launch.
Monitor Types
HTTP(S)
The most common type. Sends an HTTP request and checks the response:
- Status code — Alert if response isn't 200 (or your expected code)
- Keyword — Check that the response body contains a specific string
- Response time — Track and alert on slow responses
- SSL certificate — Alert when your certificate is expiring (configurable days before expiry)
TCP Port
Checks if a TCP port is open. Useful for:
- Database servers (PostgreSQL 5432, MySQL 3306)
- SMTP servers (25, 587)
- Custom services that don't serve HTTP
Ping (ICMP)
Basic reachability check. Good for:
- Network devices (routers, switches)
- Servers where you only care about host-level availability
- WAN/ISP monitoring
DNS
Verifies DNS resolution:
- Check that a domain resolves to the expected IP
- Monitor DNS propagation after changes
- Detect DNS hijacking
Docker Container
Monitors Docker container status directly (requires Docker socket access):
volumes:
  - /var/run/docker.sock:/var/run/docker.sock:ro
Checks if a specific container is running. Faster than HTTP checks and works for services without a web interface.
Other Types
- gRPC — Monitor gRPC services
- MQTT — Monitor MQTT brokers
- SQL queries — Run a query and check results (MySQL, PostgreSQL, SQL Server)
- Radius — Monitor RADIUS authentication servers
- Game servers — Steam, Minecraft, and other game protocols
Want more monitoring guides? Get guides like this in your inbox — Self-Hosted Weekly delivers one free deep-dive every week.
Notification Channels
Uptime Kuma supports 90+ notification services:
Self-Hosted Friendly
- Gotify — Self-hosted push notifications
- ntfy — Self-hosted push notifications (pub/sub model)
- Matrix — Encrypted chat notifications
- Apprise — Meta-notification service
Popular Services
- Email (SMTP) — Direct email notifications
- Discord — Webhook notifications
- Slack — Webhook notifications
- Telegram — Bot notifications
- Pushover — Push notifications
- PagerDuty — Incident management
Webhook
Generic webhook support for custom integrations:
{
    "heartbeat": {
        "status": 0,
        "time": "2026-02-09 12:00:00",
        "msg": "Connection refused",
        "ping": null
    },
    "monitor": {
        "name": "My Service",
        "url": "https://myservice.example.com"
    }
}
Status Pages
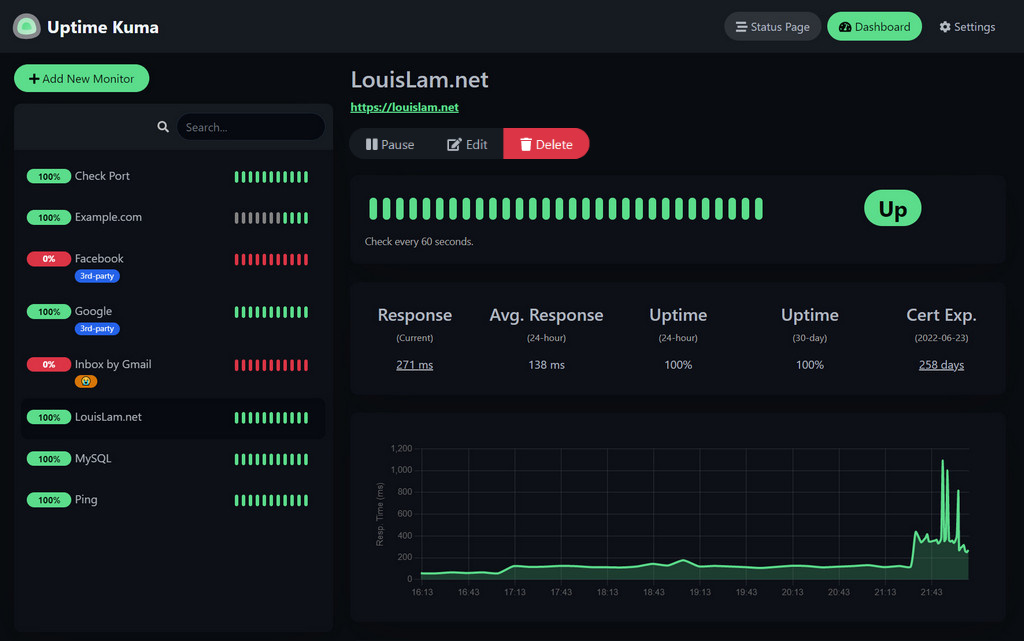
Status pages are Uptime Kuma's standout feature. Create public-facing pages that show your services' current status and incident history.
Setting Up a Status Page
- Go to Status Pages in the sidebar
- Click New Status Page
- Configure:
- Title — "My Services Status"
- Slug — URL path (
/status/my-services) - Description — Optional description
- Custom CSS — Brand your status page
- Add monitor groups — organize services into logical sections
- Publish — the page is accessible without login
Custom Domain
Put the status page behind a reverse proxy with a custom domain:
# Caddy
status.yourdomain.com {
    reverse_proxy uptime-kuma:3001
}
Incident Management
Post incidents directly on your status page:
- Click Create Incident on the status page
- Set the title, content (markdown), and style (info/warning/danger/primary)
- The incident appears on the public status page
- Update or resolve it as the situation changes
Maintenance Windows
Schedule maintenance to suppress false alerts:
- Go to Maintenance in the sidebar
- Create a maintenance window with:
- Title — "Server updates"
- Schedule — One-time or recurring (cron expression)
- Duration — How long the maintenance lasts
- Affected monitors — Which monitors to silence
- During maintenance, affected monitors show "Maintenance" instead of "Down"
- Status pages show the maintenance banner
Configuration Tips
Heartbeat Interval
Default is 60 seconds. Adjust based on your needs:
- Public-facing services — 30-60 seconds (quick detection)
- Internal services — 60-300 seconds (reduce noise)
- Network devices — 120-300 seconds (ping is cheap but frequent alerts are annoying)
Retry Logic
Configure retries before alerting:
- Retries — How many times to retry before marking as down (default: 1)
- Retry interval — Seconds between retries (default: 60)
Set retries to 2-3 for services that occasionally have brief hiccups. This reduces false alerts significantly.
Certificate Expiry Monitoring
For HTTPS monitors, enable certificate expiry notifications:
- Certificate expiry notification — Alert X days before SSL cert expires
- Default is 7 days, but 14-30 gives more time to act
Tags
Tag monitors for organization:
location:homelab/location:vpstype:web/type:database/type:networkpriority:critical/priority:low
Tags are visible in the dashboard and can be filtered.
Uptime Kuma vs Gatus vs Statping
| Feature | Uptime Kuma | Gatus | Statping-ng |
|---|---|---|---|
| UI | Beautiful web UI | Minimal | Good |
| Configuration | Web UI | YAML | Web UI |
| Status pages | Built-in (excellent) | Built-in | Built-in |
| Monitor types | 15+ | HTTP, TCP, DNS, ICMP | HTTP, TCP, ICMP |
| Notifications | 90+ services | 10+ services | 10+ services |
| Docker monitoring | Yes | No | No |
| Maintenance windows | Yes | No | No |
| API | Yes | Yes | Yes |
| Resource usage | ~150 MB RAM | ~30 MB RAM | ~100 MB RAM |
| Configuration as code | No (UI only) | Yes (YAML) | No |
Choose Uptime Kuma When
- You want the best-looking dashboard and status pages
- You need many notification options
- You prefer UI-based configuration
- You want maintenance windows and incident management
Choose Gatus When
- You prefer configuration as code (YAML)
- You want minimal resource usage
- You need simple, reliable checks without bells and whistles
- You're running in Kubernetes and want GitOps
Backup
Uptime Kuma stores everything in a SQLite database. To back up:
# Stop Kuma briefly for a consistent backup
docker compose stop uptime-kuma
cp /path/to/uptime_data/kuma.db /backup/kuma-$(date +%F).db
docker compose start uptime-kuma
Or use the built-in backup feature (Settings → Backup).
Verdict
Uptime Kuma is the best self-hosted uptime monitor available today. The UI is polished enough that non-technical users can understand the dashboard, the status pages look professional enough for customer-facing use, and the notification support covers every possible channel.
The only downside is that configuration is UI-only — you can't define monitors in a YAML file and deploy them with infrastructure-as-code. If that's important to you, look at Gatus. For everyone else, Uptime Kuma is the clear choice. Install it, add your services, set up a status page, and you'll wonder how you managed without it.